Barrels Don't Move First: An Execution Audit for API and EIA Weeks
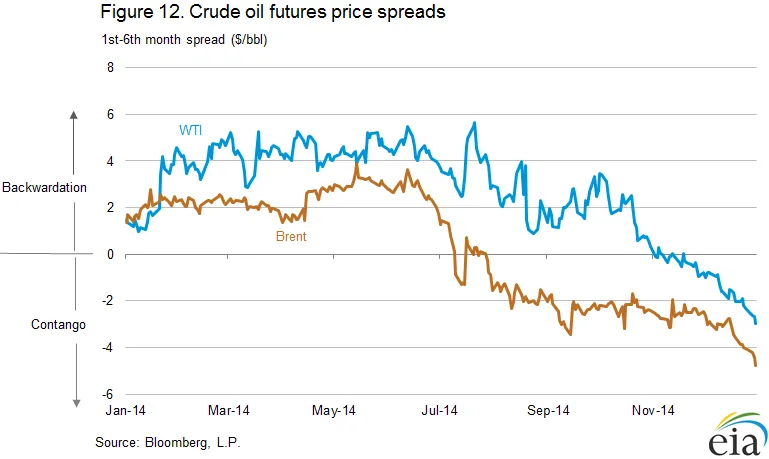
Photo: U.S. Energy Information Administration, Public domain, via Wikimedia Commons
Crude inventory weeks have a rhythm that is easy to misread. The headlines arrive like clockwork, the commentary turns directional within seconds, and the tape often does something else entirely. For traders working CL, RB, and HO, the more useful question is not what the barrel count means for the next $5 move. It is what the release does to the order book, the spread complex, and the resting stops that sit inside the noise.
That distinction matters because inventory reports are scheduled liquidity events before they are fundamental events. The API release on Tuesday afternoon and the EIA report on Wednesday morning do not simply add information. They remove depth, widen spreads, and reprice the cost of immediacy. A trader who sizes for the number without sizing for the book is taking a different risk than the one being modeled.
The Print Is Not the Move; the Book Is
The weekly sequence is familiar. The American Petroleum Institute publishes its estimates after Tuesday's settlement, typically around 4:30 p.m. ET. The U.S. Energy Information Administration follows Wednesday at 10:30 a.m. ET with the official weekly petroleum status report. Both releases land in windows where liquidity is structurally thinner than the midday session: the API print in the electronic evening, the EIA print in the late-morning lull before the lunchtime flow.
In CL, the front-month contract usually sees the most visible reaction, but the second-month and the calendar spreads often tell a cleaner story. When the market is genuinely repricing storage or prompt tightness, the front spread moves with the outright. When the move is a headline spike, the spread may lag or fade. That divergence is worth auditing week to week because it separates a liquidity event from a fundamental repricing.
RB and HO are not passengers. Gasoline and distillate components can produce their own relative moves, especially when the report lands near seasonal inflection points for driving demand or heating oil. A crude draw that looks bullish at the headline can coexist with a product build that weakens the crack. The trader who watches only CL is watching one third of the complex.
Tuesday Afternoon: The API Fade
The API window begins before the number. In the final 30 to 45 minutes before the release, depth in the front-month CL book tends to thin. Market makers reduce size, top-of-book quotes become less reliable, and the bid-ask spread can widen from a tick to several ticks. This is the pre-print bid-ask fade, and it is not a signal. It is a cost.
Resting stops are especially vulnerable in this window. A thin book can produce wicks that look like breakdowns or breakouts but are simply the mechanical result of reduced liquidity. Traders who leave tight stops in the market through the API release are effectively donating to the event. The better practice is to widen the noise band or reduce size before the window, not after the first spike.
The API number itself is private data, and its relationship to the EIA report is imperfect. Treating Tuesday's print as a preview of Wednesday's official number is a common error. The more disciplined approach is to treat the API release as a liquidity stress test: observe how the book absorbs the surprise, note whether spreads confirm the outright move, and carry that information into the EIA session.
Wednesday Morning: The EIA Repricing
The EIA report is the main event, but the first two to five minutes after 10:30 a.m. ET are rarely a clean trading environment. Price discovery is fast, spreads are wide, and order flow is fragmented. Market orders in this window pay for urgency. Limit orders may sit unfilled while the market moves away.
A more useful frame is the post-print mean-reversion window. After the initial spike or selloff, the market often enters a period of 15 to 45 minutes in which the first reaction is tested. This is not a guarantee of reversal. It is a window in which liquidity begins to rebuild and the market decides whether the headline move is supported by the spread complex. If the front spread confirms the outright, the move has a better chance of holding. If the spread fades while the outright holds, the move may be flow-driven rather than fundamentally anchored.
For RB and HO, the same logic applies with an extra layer. The product cracks can reprice more slowly than the outright because the report's product components take time to digest. A trader watching only the CL reaction may miss the more durable move in the gasoline or distillate crack. The audit question is not which market moved first, but which market moved with confirmation from its own spreads.
A Three-Step Checklist for Event Risk
First, size to liquidity rather than conviction. Define the maximum event risk in contracts and ticks before the release, not after the first candle. If the book is too thin to execute the intended size without undue slippage, the size is too large for the event. This is an execution decision, not a directional one.
Second, separate the thesis from the trade expression. If the view is genuinely about inventory levels, a spread or an options structure may express it with less exposure to the outright's first-minute noise. If the view is about the market's reaction, then the trade is a liquidity trade and should be sized accordingly. Mixing the two is how a weekly report becomes an unintended macro bet.
Third, pre-stage orders and stops outside the expected noise band. Use limit orders where possible, avoid market orders in the first minutes after the EIA release, and audit the fill quality afterward. The post-mortem should ask whether the loss came from the thesis or from the execution window. Those are different problems with different fixes.
What to Audit After the Week
The useful record is not whether the number was bullish or bearish. It is how the book behaved before and after the print. Note the bid-ask width in CL, RB, and HO before the API release and before the EIA release. Note the depth at the top of book. Note whether the front spread confirmed the outright move. Note the time it took for spreads to normalize.
Over several weeks, those observations become a practical map of event liquidity. The trader who has that map can size inventory-week risk with more precision and less drama. The barrel count will still make headlines. But the execution edge comes from reading the book first.