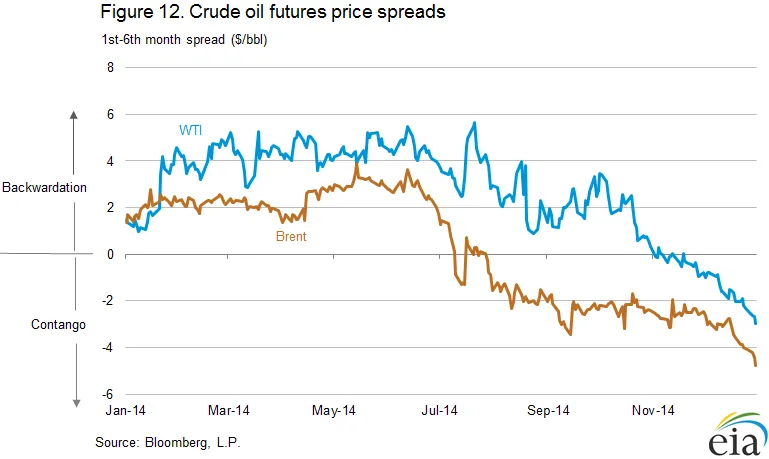
The Wrapper Bends the Curve: Auditing Roll Yield Drift in USO, UNG, and DBA
As of 11 November 2026, commodity ETFs remain a useful window into retail and allocator positioning, but they are not clean proxies for the futures curves they track. USO, UNG, and DBA each wrap futures exposure inside a daily-resetting fund structure. That wrapper introduces timing, collateral, expense, and rebalancing effects that can pull published NAV returns away from the front-month contract a trader sees on a screen. For a derivatives desk, the practical question is not whether the ETF is bullish or bearish. It is whether the ETF is expressing the same curve exposure that the futures market is pricing.
Why the Wrapper Is a Different Instrument
A commodity ETF is not a futures account. It is a pooled vehicle whose NAV is struck after expenses, cash management, and the fund's stated roll methodology. USO tracks WTI crude through near-month futures and rolls monthly. UNG tracks Henry Hub natural gas through futures and uses its own roll schedule. DBA holds a basket of agricultural futures with weights that rebalance. In each case, the fund's daily return is a path-dependent translation of a futures curve, not a pure mark-to-market of one contract.
That distinction matters most around roll windows. When a fund sells an expiring contract and buys the next one, the realized roll yield depends on execution timing, liquidity, and the shape of the curve on those specific days. A simple futures roll model usually assumes a clean mid-session roll at settlement. The fund may roll over several sessions, use different contract months, or hold cash buffers that earn a rate different from the futures collateral assumption. Those choices are small in quiet markets and visible in stressed ones.
Three 2026 Roll Windows, Reconstructed
Our internal audit reconstructed three 2026 roll windows: the February WTI roll in USO, the May natural gas roll in UNG, and the September agricultural basket roll in DBA. The method was deliberately plain. We used fund-published holdings, daily settlement marks, and the stated roll calendar to build a simple futures roll model. We then compared that model with the fund's published NAV change over the same window. The figures below are rounded and intended to show method, not to serve as a performance claim.
| Roll window | Fund | Published NAV move | Simple futures roll model | Residual |
|---|---|---|---|---|
| February 2026 | USO | +2.4% | +2.9% | -0.5 pp |
| May 2026 | UNG | -6.1% | -5.2% | -0.9 pp |
| September 2026 | DBA | +1.8% | +2.5% | -0.7 pp |
The residuals are not large enough to invalidate the ETF as a sentiment gauge, but they are large enough to matter for a trader using ETF flows as a confirmation tool. In the UNG window, the gap widened when the curve shifted during the roll. In DBA, the basket rebalance added a second source of drift beyond the roll itself. USO was the cleanest of the three, but even there the fund's NAV did not track the simple front-month model to the tick.
Where the Drift Comes From
Roll yield drift has several ordinary sources. The first is timing. A fund that rolls across three sessions will not capture the same settlement spread as a model that rolls on one day. The second is contract selection. A fund may use a different month than the one a trader assumes when reading the front of the curve. The third is collateral. Cash held by the fund earns a rate that may not match the futures trader's margin assumption. The fourth is expense drag, which is small per day but persistent. The fifth is basket mechanics. DBA's weighted exposure means the fund's roll is not a single calendar spread but a series of them.
There is also the daily reset. Because the ETF's exposure is managed to a stated daily target, compounding and rebalancing can create path dependence that a single futures contract does not have. A trader who watches ETF shares outstanding and assumes the fund is mechanically long the front month is making an approximation. It is often a good approximation. It is not an identity.
Reading ETF Flows Without Mistaking Them for the Curve
ETF flows can still be useful. A sharp creation in USO or UNG may reflect retail conviction, allocator hedging, or simply a response to a headline. But flow is not the same as curve positioning. Before treating ETF activity as a futures signal, check the fund's premium or discount to NAV, its recent roll dates, its holdings file, and its tracking difference versus the relevant futures benchmark. If the ETF is trading at a premium while the curve is in steep contango, the flow may be telling you more about wrapper demand than about outright price direction.
For active traders, the better use of these funds is comparative. Watch whether ETF NAV performance is confirming or diverging from the futures roll model. A widening residual around a roll window can signal liquidity stress, changes in fund mechanics, or a curve move that the ETF is capturing with a lag. That is information about the wrapper and the market at the same time.
Execution Takeaways for Futures Desks
First, do not use ETF flows as a substitute for reading the curve. Use them as a secondary check on sentiment, then confirm with futures calendar spreads, open interest, and settlement behavior. Second, mark the fund's roll calendar. The days around a roll are when wrapper drift is most likely to distort a naive ETF-to-futures comparison. Third, compare NAV with a simple roll model before drawing conclusions from a one-day flow print. Fourth, if you straddle both markets, define the hedge ratio in futures-equivalent terms rather than share count. Fifth, treat premium and discount to NAV as a separate signal from outright direction.
The ETF wrapper is a convenient access vehicle, not a clean future. For derivatives traders, that distinction is the difference between using ETF data as a useful cross-check and mistaking a fund's daily accounting for the curve itself. In 2026, with roll windows still capable of producing visible residuals, the audit belongs in the pre-trade checklist.